← All templates
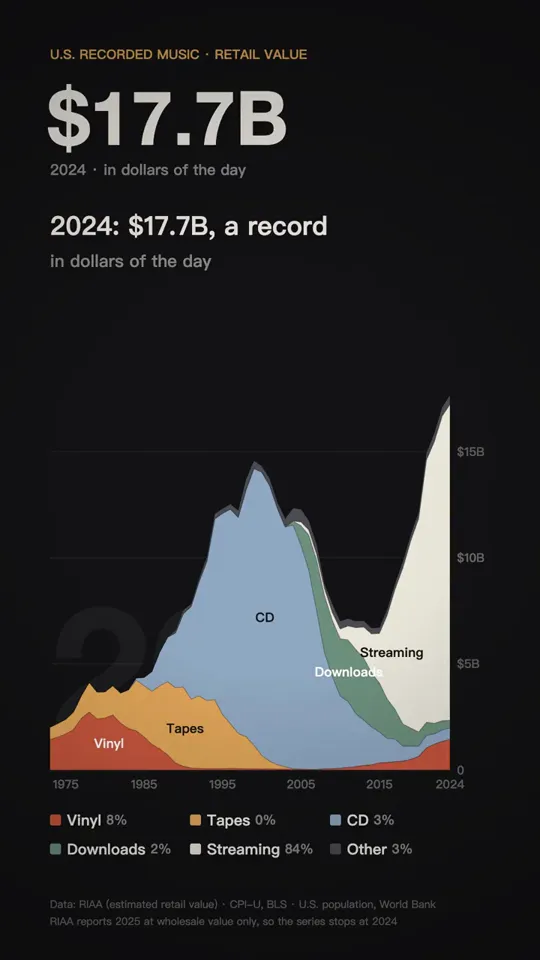
Stacked Area Chart Animation
How an energy mix, a revenue mix or a market share changed
Make the same video as the "Stacked Area Chart Animation" template on ultramotion.ai: https://ultramotion.ai/templates/mix-over-time/

If you can install skills, run npx skills add sunsiyuan/ultramotion first and use examples/music-formats.html in skills/data-story as the starting point: copy it and keep the look, the pacing, the camera, the type and the music exactly as they are; only replace what is in 【】 below with mine. If the words are longer or shorter, change the size and the line breaks, not the structure. Use real data and compute every number on screen from the data file. If you can't install skills, make the same video as the one on that page from scratch.

My content:
- What is split up: 【what Americans spend on recorded music】
- The parts: 【vinyl, tapes, CDs, downloads, streaming】
- From when to when: 【1973–2024】
- Data source: 【…】

Deliver: Vertical 1080×1920, 30 fps, an mp4 with music, in the current directory.
Made at 9:16. For another size (9:16, 16:9, 4:5, 1:1), say so in the prompt.
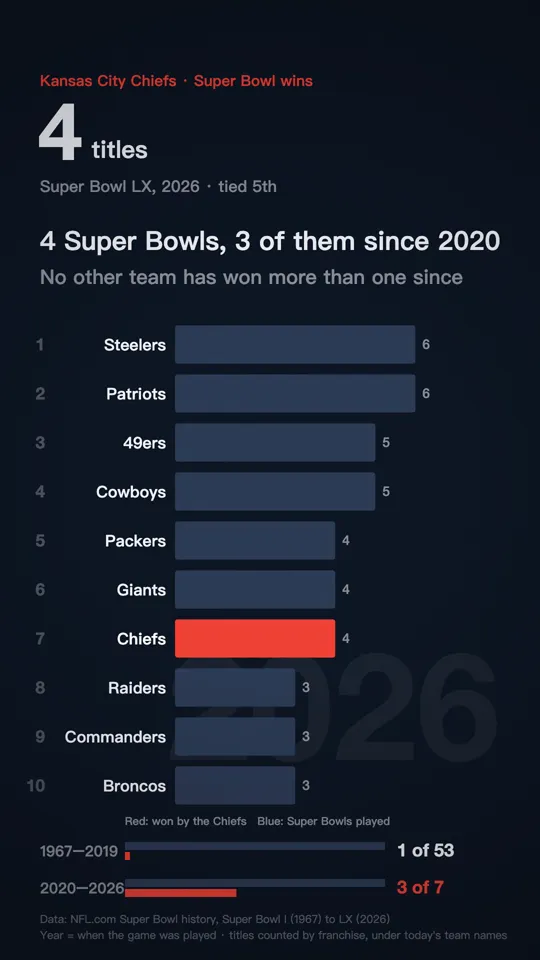 Bar Chart Race
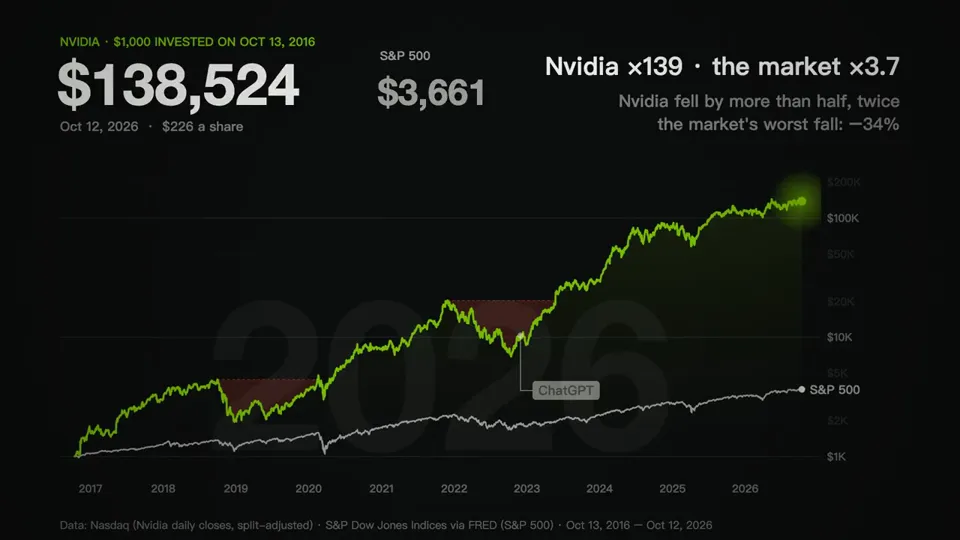 If You Had Bought It Then
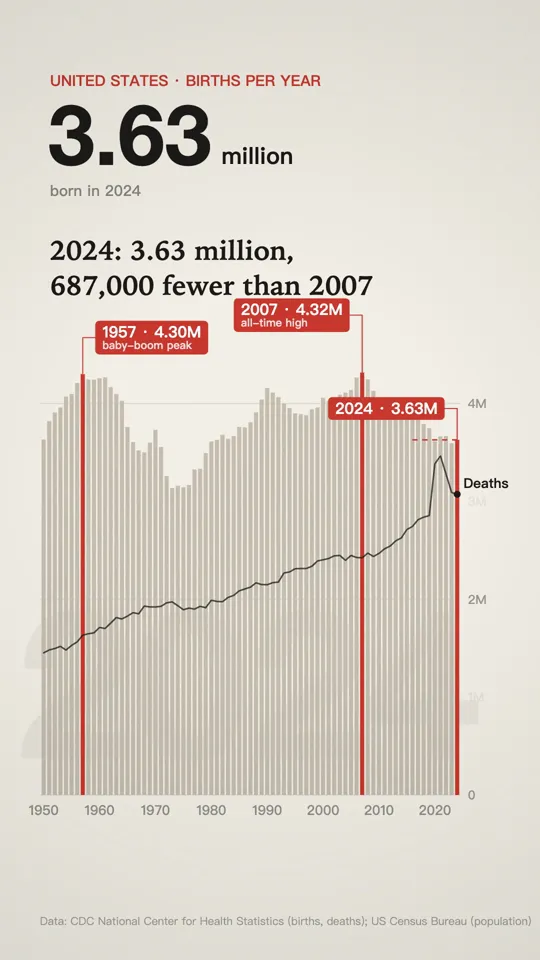 Animated Chart Over the Years